Publisher : China Statistics Press Published Date : 08/2017 Frequency : Annually Language : English and Chinese bilingual ISBN/ISSN : 978-7-5037-8282-4 Weight : 3.10kg Availability : Printed Version;Electronic Version(PDF)
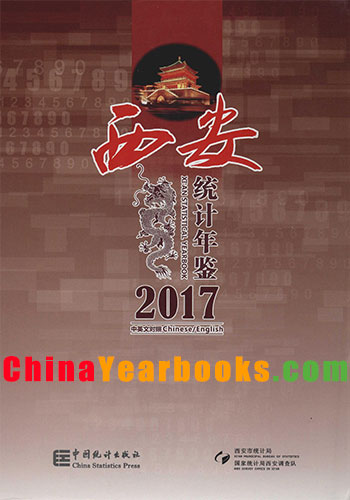
Xi’An Statistical Yearbook 2017
Ⅰ.Xi’an Statistical Yearbook 2017 is a periodical statistic yearbook which record economic and socialdevelopment of Xi’an all-around data in 2016 and some selected data series in historical important years.With its features of comprehensive and intensive information,this practically provides data covering thesituation of social and economic developments in Xi’an. Ⅱ.The book contains twenty-two parts,1.General Survey;2.Basic Unit;3.National Economic Account;4.Population,Employment and Wages;5.Investment in Fixed Assets;6.Government Finance;7.PriceIndices;8.People’s Livelihood;9.Urban Public Utilities;10.Environmental Protection;11.Agriculture;12.Industry;13.Energy;14.Construction;15.Transportation,Post Telecommunication Service andInformatization;16.Domestic Trade;17.Foreign Trade;18.Tertiary Industry;19.Banking and Insurance;20.Education,Science and Technology;21.Culture,Sports,Public Health,Social Welfare Institutions andOther Social Activities;22.Enterprises Investigation.As insert pages including statistical graphs andcharts.Meanwhile,for the convenience of the reader,before each chapter,we make a brief descriptionand the main statistical indicators,summarize the main contents of this charpter,sources of informationand historical changes.At the end of the charpter,explanation of key statistical indicators areattached. Ⅲ.The data of various years in conformity to the statistical standards prescribed by national statisticalsystem of the time.The meaning,scope and calculating method of indicators may have some difference indifferent periods,which readers must pay attention to.For example,national industries classification iscarried out according to standard GB/T4754-2011. Ⅳ.For the convenience of being consulted by foreigners,the book is Chinese-English bilingual edition. Ⅴ.In this yearbook,data in 2013 at the part of National Economic Account and Industry is the resultsof Third National Economic Census,the data from 2009 to 2012 at the part of National Economic Accountand data from 2009 to 2013 at the part of Domestic Trade have adjusted by Third National EconomicCensus,we also revised the industrial added value above designated size from 2009 to 2012. Ⅵ.Statistical discrepancies due to rounding are not adjusted automatically in this yearbook. Ⅶ.Unit of measurement is used in this yearbook according to 2016 statistics system. Ⅷ.Explanations on symbols used in this yearbook: (Blank) indicates the data not available; # indicates the items of the total. * indicates some other explanatory note. Here we would like to express our sincere thanks to the people tor their concerning and support to theXi’an statistical yearbook.In order to do better and provide better service to readers,we hope that the wholesociety fields can propose constructive advices.
Publisher : China Statistics Press Published Date : 09/2017 Frequency : Annually Language : English and Chinese bilingual ISBN/ISSN : 978-7-5037-8262-6 Weight : 3.10kg Availability : Printed Version;Electronic Version(PDF & CD & EXCEL)
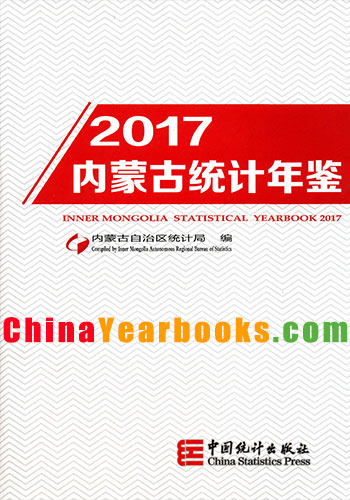
Inner Mongolia Statistical Yearbook is a regular large scale statistical reference book published yearly.With a vast amount of statistical data for 2016,this yearbook reflects various aspects of Inner Mongolia’s economic society,science and technology development.It is really an important and efficient statistical reference book for people of various circles in and outside China to know and understand Inner Mongolia.
Ⅰ.Inner Mongolia Statistical Yearbook is a regular large scale statistical reference book published yearly.With a vast amount of statistical data for 2016,this yearbook reflects various aspects of Inner Mongolia’s economic society,science and technology development.It is really an important and efficient statistical reference book for people of various circles in and outside China to know and understand Inner Mongolia. Ⅱ.The yearbook has two parts:Special articles and Statistics.The first part consists of important documents of the Party and the government and Statistical Bulletin of the National Economic and Social Development in Inner Mongolia for2016.The second part consists of all the 24 chapters as follow:1.Division of Administrative Areas and Natural Resources;2.General Survey;3.National Accounts;4.Population;5.Employment and Wages;6.Investment in Fixed Assets;7.Energy and Environmental;8.Government Finance;9.Prices Indices;10.People’s Livelihood;11.General Survey of Cities;12.Agriculture;13.Industry;14.Construction;15.Transport,Postal and Tele-communications Services;16.Domestic Trade;17.Foreign Trade and Economic Cooperation;18.Tourism;19.Banking and Insurance;20.Education,Science and Culture;21.Sports,Public Health,Social Welfare and Other;22.Information of Leagues and Cities;23.Information of Banners and Counties(Districts and Cities);24.Appendix.In order to make it convenient for readers to consult,we edit exploratory notes on main statistical indicators of every chapter. Ⅲ.Most of the data in this yearbook sources are from annual statistical reports of government agencies,another part sources from sample survey. Ⅳ.Comparing with the content of Inner Mongolia Statistical Yearbook-2016,we changed the content as follow: The 17th part consists of Foreign Trade Economic Cooperation add index of Imports and Exports with “The Belt and Road”、Utilization of Foreign Capital by country,and adjust the layout. Ⅴ.The units of measurement used in this yearbook are internationally standard measurement units. Ⅵ.Statistical discrepancies due to rounding are not adjusted in this yearbook. Ⅶ.The notes concerning the whole table are placed at the upper part of table,while the notes concerning individual indicators are placed at the lower part. Ⅷ.Notations used in this yearbook:blank space indicates that the figure is not large enough to be measured with the smallest unit in the table,or data are unknown or are not available;”#” indicates a major breakdown of the total.
China Food Industry Yearbook 2016 Publisher : China Statistics Press Published Date : 02/2017 Frequency : Annually Language : Chinese ISBN/ISSN : 978-7-5037-8094-3 Weight : 3.0kg Availability : Printed Version;Electronic Version(PDF )
Publisher : China Statistics Press Published Date : 08/2017 Frequency : Annually Language : English and Chinese bilingual ISBN/ISSN : 978-7-5037-8332-6 Weight : 3.0kg Availability : Printed Version;Electronic Version(PDF )
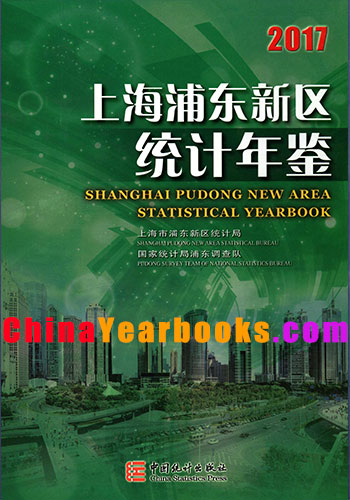
Shanghai Pudong New Area Statistical Yearbook 2017
Ⅰ.Statistical Yearbook of Shanghai Pudong New Area(PNA)—2017 is a large,comprehensive reference book.With great amount of data and in both Chinese and English versions,it records recent years’ social and economic development in PNA.It describes the changes in economy,society,science and technology,and key development zones in PNA’s new stage of “Second Startup for Business” in 2016.It is a desktop tool-book meant for leaders at all levels,theorists,practitioners,and people at home and abroad who are interested in PNA,want to do research work on Pudong and intend to participate in its development and its construction. Ⅱ.Great changes happened to the administrative system of Pudong New Area in 2009.On April 24,the State Council approved to add the administrative area of Nanhui District into Pudong New Area.On May 6,the Shanghai Municipal government formally announced the combination of these two districts.Because of data of previous years in these two districts can not be added simply while they had been produced with different statistical methods,approached and areas and it is hard to trace them.Unless specified,the statistical data in this Yearbook are those of new PNA(including former Nanhui District) since 2009,and the data of previous years are those of former PNA. Ⅲ.In 2011 and 2012,administrative divisions of some towns in PNA were readjusted.On October 28,2011,Shanghai People’s Government approved the establishment of the new Chuansha New Town after rescinding the former Chuansha New Town and Liuzao Town,approved the establishment of the new Zhuqiao Town after rescinding the former Zhuqiao Town,and readjusted the administrative divisions of these two new towns.On August 30,2012,the municipal government approved the establishment of the new Nanhui New Town after rescinding Shengang Sub-district and Luchaogang Town,and readjusted its administrative division. Ⅳ.The annual average growth rate in this Yearbook is extracted from the multiplication of the annual chain growth rates. Ⅴ.This book falls into nineteen chapters:1.General Survey;2.Population;3.Investment in Fixed Assets;4.Business Promotion and Foreign-fund Attraction;5.Agriculture;6.Industry;7.Construction;8.Finance and Banking,and Factor Markets;9.Real Estate;10.Domestic and Foreign Trades;11.Services,Tourism and Hotels;12.Science and Technology;13.People’s Livelihood;14.Employment and Social Security;15.Education;16.Culture and Sports;17.Public Health;18.Laws,Public Order and Others;19.Urban Construction and Environmental Protection;20.Key Development Zones and Sub-districts and Towns;21.Statistics of Shanghai Municipality. Ⅵ.The units of measurement in this book are consistent with international standards. Ⅶ.No adjustment has been made to correct the deviations of some of the figures in the Yearbook caused by different methods used in rounding. Ⅷ.In November 1995,PNA rescinded township system and adopted town system.Villages are supervised by towns in the town system.Therefore,in this book,the meanings of “town” and“town and town-above industry” are the same as“township” and“township and township-above industry” in other Chinese statistical books. Ⅸ.Notations used in this Yearbook: “#”indicates the major item of a certain indicator, “…”indicates the figure which is too small to be measured by the smallest unit in the table, “blank” indicates the data unavailable or none in certain statistical indicator. Ⅹ.According to relevant stipulations by the State Council and National Bureau of Statistics,GDP of Pudong New Area is to be renamed as Gross Output Value of Pudong New Area,shortened as PNA Gross Output Value starting from 2004. Ⅺ.All added values and gross output vales in the Yearbook are listed in terms of current prices while growth rates listed in terms of comparable prices. Ⅻ.If any statistical data from other sources conflict with the data in the present Yearbook,datain the present Yearbook shall apply. ⅩⅢ.The publication of Pudong New Area Statistical Yearbook has received great attention.Our gratitude and appreciation go to all the readers who have offered their comments.We welcome and are open to more comments and suggestions from our readers when presenting this new edition. We appreciate the great support and efforts of Shanghai Statistics Bureau,all the commissions,offices and bureaus,and administrations of all the development zones in PNA during compilation of the present Yearbook.
Publisher : China Statistics Press Published Date : 07/2017 Frequency : Annually Language : English and Chinese bilingual ISBN/ISSN : 978-7-5037-8152-0 Weight : 3.10kg Availability : Printed Version;Electronic Version(PDF & CD)
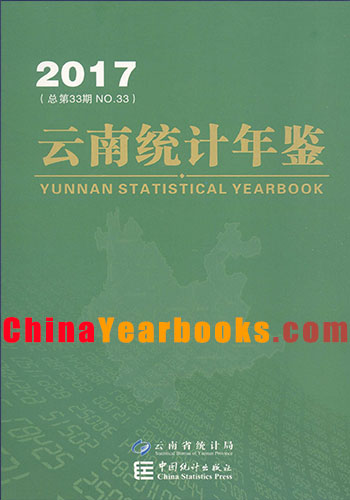
Yunnan Statistical Yearbook 2017
Ⅰ.Yunnan Statistical Yearbook 2017 is an annual statistics reference book which fully reflects the national economy and social development in Yunnan province.The present yearbook covers comprehensive data in each city,county and prefecture in 2016 as well as some key data in significant years of the whole province. Ⅱ.After revision,this book contains the following eighteen parts:1.Provincial survey;2.Economies;3.Investment in Fixed Assets;4.Urban and Rural Consumption;5.Public Finance;6.Foreign Trade;7.Agriculture and Country;8.Industry and Energy;9.Construction and Real Estate;10.Transport,Communications,and service Industry;11.Finance and Insurance;12.Tourism;13.Education,Science and Technology and Culture;14.Public Health,Sports and Social Services;15.Population and Employment;16.Resources and Environment;17.Survey of National Autonomous Area;18.Survey of Intra-county Economies. Ⅲ.Explanatory Notes on Principal Statistical Indicators are provided at the end of each part to describe the content,scope and method of provincial statistical indicators briefly.The major data in this publication are obtained from annual statistical reports.It is advisable to note in the reference that the sum of data of each city,county and prefecture may not correspondingly equal the total of the whole province in some statistical indicators due to different statistical ranges and investigation methods.As for changes of statistical ranges,the relevant data are adjusted and explained accordingly in the present yearbook. Ⅳ.The units of measurement used in this book are international standard measurement units issued by the state.Notations used in this yearbook,“(Blank)” indicates that the data are not available;or refers to numbers of minimum units or refers to numbers which are not in detail.“#” indicates that the major items of the total. Ⅴ.Thanks for the great support and attention given by party members and governments at each level,and colleagues who participate in this editing work.In order to perfect the yearbook and meet the requirements of the society better,comments from various readers are highly appreciated.At the same time,readers are welcome to correct our mistakes made in this book.
Publisher : China Statistics Press Published Date : 07/2017 Frequency : Annually Language : English and Chinese bilingual ISBN/ISSN : 978-7-5037-8152-0 Weight : 3.10kg Availability : Printed Version;Electronic Version(PDF & CD & EXCEL)
Suzhou-Statistical-Yearbook-2017
Ⅰ.Suzhou Statistical Yearbook 2017 is a publication which provides comprehensive and sys-tematic data covering the economic and social development in Suzhou Municipality in 2016. Ⅱ.This yearbook is comprised of 22 parts including Achievement Graphs and Charts,GeneralSurvey,Population and Labor Force,Agriculture,Industry,Construction,Transportation,Post andTelecommunication,Wholesale,Retail Sales and Catering Business,Export-Oriented Economy andInternational Tourism,Services,Consumption of Energy,Investment in Fixed Assets,EnterprisesSurvey,Finance,Banking and Insurance,Price Indices,People’s Livelihood,Science and Technolo-gy,Education and Culture,Public Health and Sports,Civil Administration,Judiciary and OtherItems,Urban Construction and Environmental Protection,Cities Compare. Ⅲ.The statistics in the yearbook are mainly the statistics in 2016,and the main indicators alsolist the statistical data in the key years since the founding of the People’s Republic of China.Thedata mainly comes from the periodic statistical reports and sample survey data of Suzhou MunicipalBureau of Statistics and Suzhou Investigation Team of National Bureau of Statistics,and some ofthe information comes from administrative departments of Suzhou municipal government. Ⅳ.According to the changes of the national statistical system,some historical data is adjustedaccordingly,and in the use of historical data,when the data in previous yearbooks is different fromthat in this yearbook,the data in this yearbook is to be used. Ⅴ.In September,2012 Wujiang City was changed into Wujiang District,and the originalChanglang District,Pingjiang Dictrict and Jinchang District were merged to become Gusu District.The whole city’s data in the yearbook includes the data of Gusu District,Wuzhong District,Xiang-cheng District,Huqiu District、Suzhou New District,Suzhou Industrial Park,Wujiang District,Changshu City,Zhangjiagang City,Kunshan City and Taicang city,and the data of the central cityincludes that of Wujiang District(except the data of meteorology,hydrology and price). Ⅵ.Explanations on symbols used in this yearbook: “…” indicates that the data are not large enough to be rounded into the minimal unit, “space” indicates that the data is unknown and indicates the data not available, “-” indicates the data not available, “#”indicates the component items. Here we’d like to express our sincere thanks to the readers who have provided us so many in-valuable suggestions on content selection and compilation of the yearbook.Our thanks also go tothose friends in all circles of society who have shown their support and care to the publication ofthe yearbook.We welcome any suggestions and comments from readers at large so as to help us tofurther improve our work of compilation.
Publisher : China Statistics Press Published Date : 12/2016 Frequency : Annually Language : English and Chinese bilingual ISBN/ISSN : 978-7-5037-8082-0 Weight : 2.10kg Availability : Printed Version;Electronic Version(PDF & EXCEL)
China City Statistical Yearbook 2016
China City Statistical Yearbook is an annual statistical publication.China City Statistical Yearbook 2016 reflects comprehensively the economic and social development of Cities in China.It covers the main socio-economic statistical data of cities at all levels for 2015. The Yearbook contains four parts:Part Ⅰ is the administrative division of all cities,listing city distribution by region and level;Part Ⅱ and Part Ⅲ are the statistical data of cities at prefecture level and above,and county-level respectively on population,labour forces,land resources,general economy,industry,transport,postal and telecommunication services,commerce,foreign trade and economic cooperation,investment in fixed assets,education,culture,public health,people’s living conditions,social security,municipal public utilities,and environmental protection;Part IV is appendix of explanatory notes on main statistical indicators.It is necessary to point out that cities at prefecture level and above and county-level have used different indicator systems of statistics since1997,and some indicators in two categories of cities are not comparable.So the data of cities at prefecture level and above and the data of cities at county-level are divided into two independent parts in the yearbook. The national data in this yearbook do not include those of Hong Kong Special Administrative Region,Macao Special Administrative Region and Taiwan Province.”Total City” listed in the data refers to all administrative regions of the city,including the city districts,counties and the city at lower level;”Districts under City” includes all the city districts,not including counties and the city at lower level.The data of districts under Wuhan City do not include those of Huangpi district,Xinzhou district,Jiangxia district and Caidian district.Some indicators of this yearbook are time-point data,the time of them is at the end of 2015. The Yearbook is compiled for the users working in government departments,city planning departments,institutes of urban socio-economic research,municipal construction and real estate agencies,intermediary services,information consulting agencies and other so on,and it is an important reference book for college teachers and students,businessmen,overseas investors as well as users paying close attention to the development of Chinese cities. The editing and publishing of the yearbook have been fully supported by the Department of Rural Surveys of NBS,Bureaus of Statistics and Survey Offices of NBS at provincial prefecture and county level,and China Statistics Press.Here we would like to express our heartfelt thanks to them. Department of Urban Surveys National Bureau of Statistics of China December,2016
China Agri-culture Yearbook 2016 PDF Version of English Download
1.This Yearbook refers to the development and information of agriculture,forestry,animal husbandry,fishery,land reclamation,farm machinery,water conservancy,meteorology,agricultural natural disaster,etc.in China.It has been published both in Chinese and English since 1985.
2.The English edition bases itselfmainly on the Chinese edition of China Agri-culture Yearbook 2016.The compilation isunder the auspices of the Ministry of Agricul-ture and from the assistance of various minis-tries and state departments concerned.Thedata of the statistics of agricultural economyare from the National Bureau of Statistics,Ministry of Agriculture,State Forestry Ad-ministration,Ministry of Water ResourcesChina Meteorological Administration and General Administration of Customs,etc. The English edition of this Yearbookdoes not include the information fromHongkong,Macao,and Taiwan Province ofChina unless specially stated.
Beijing Statistical Yearbook-2017 Download (CD Version contain EXCEL files)
beijing-statistical-yearbook-2017
Beijing Statistical Yearbook is a large statistical book published continuously on a chronological basis. With a great deal of statistical data, this Yearbook gives a true reflection of the social and economic development and changes in Beijing over the past year. It serves as an important reference book for domestic and foreign personnel in all circles to understand and know Beijing.
Framework Structure
(I) Overall Structure
The overall structure of Beijing Statistical Yearbook remains basically stable. In color pages, main tendency and changes about economic and social development of Beijing have been presented with both illustration and pictures; statistical tables are the main part of this Yearbook, mainly including 23 chapters, i.e. General Survey; National Accounts; Population and Employment; Government Finance and Tax Revenues; Energy, Resources and Environmental Protection; Total Investment in Fixed Assets and Real Estate Development; Foreign Trade; Price Index; People’s Livelihood; Public Utilities; Agriculture and Rural Economy; Industry; Construction; Tertiary Industry; Transport, Post and Telecommunication Service; Wholesale and Retail Trade, Accomodation and Restaurants; Tourism; Finance and Insurance; Education and Culture; Science and Technology; Health Care and Sports; Social Welfare, Community, Plicies & Laws and Others; and Development Zones 23 chapters in total, reflecting the economic and social development situation across the city through multiple industries and fields.
(II) Structure of Chapters
Internal structure of chapters: Each chapter is composed of the Brief Introduction, Statistical Tables and Explanatory Notes to Main Statistical Indicators. Brief Introduction appears on the first page of each chapter, mainly introducing the main content, source of data, statistical scope, indicator standards, method of adjustment to historical data in each chapter; Explanatory Notes to Main Statistical Indicators come on the last page of each chapter, mainly giving a brief explanation to the main indicators and calculation method, etc. involved in the chapter; Statistical Tables are the core content of each chapter.
Arrangement of statistical tables: In each chapter, statistical tables are arranged for the purpose of reflecting the main conditions in the field. Generally speaking, historical statistical tables come before current year statistical tables.
How to Use
(I) Years
Conventionally, the year indicated in the book is the year of publication. The latest data indicated in the statistical tables in this Yearbook are data in the previous years. For example, this book is titled 2017 Bejing Statistical Yearbook, which means it will be published in 2017 while the lastest data in the book is by the end of 2016.
“Years” in the statistical tables are marked in three ways, each indicating a different meaning. Firstly, the statistical table is named “****** (AAAA- BBBB)”, which refers to that the data listed in the table are those from the year of AAAA to BBBB; Secondly, the statistical table contains no years, indicating that the data listed in the table are those of current year and last year; Thirdly, the statistical table is named “****** (AAAA)”, indicating that the data listed in the table are those of the year of AAAA.
(II) Symbols
Symbols in statistical tables include:
#: means that the item is included in the total. Grouped indicators marked with “#” are part of the total, while those without“#” mean that sum of inclded items equals to the total.
||: means that there are multiple ways of grouping the indicators.
…: means that the figure is less than the minimum measurement unit of the table.
Blank: mean that the figure is unknown or unavailable.
***: means that the figure is not disclosed for secrecy reasons.
(III) Explanations
Explanations include User Guide, Table of Contents, Brief Introduction, Explanatory Notes to Main Statistical Indicators and notes under the tables. User Guide appears before the Table of Contents, giving an introduction to the overall framework of this Yearbook, and explaining the main adjustments; Brief Introduction appears on the first page of each chapter, giving an introduction to the chapter’s main content, source of data, statistical scope, standards of indicators, adjustment method of historical data, etc; Notes under the statistical tables make an explanation on standard of some indicators, method and scope, etc.
(IV) Data
In general cases, the first tables in each chapter contain historical data of core indicators in the area or field. Generally speaking, historical data that are shown in one table continuously by year can be used continuously. But it is also necessary to refer to the notes under the table in order to have a full understanding of the connation of indicators; historical data that are shown in several tables indicate that there were major adjustments to relevant indicators, and they need to be reflected by sections.
In addition, some of the historical data in the latest yearbook may have been adjusted over data in previous yearbooks. Therefore please refer to the latest yearbook when enquiring or using historical data.
(V) Electronic CD-ROM
Beijing Statistical Yearbook is provided with a CD-ROM, which containes Chinese and English versions of this Yearbook. The CD-ROM helps users in working with and processing the data.
(VI) The sum of some statistics or some relative numbers in this Yearbook might have certain calculation errors because of the choice of different units of measurement. All the statistics have not undergone mechanical adjustment.
III. About 2017 Beijing Statistical Yearbook
Compared with 2016 Beijing Statistical Yearbook, the following adjustments have been mainly made:
The order of certain chapters has been adjusted in this Yearbook.
In accordance with the unified requirements of the National Bureau of Statistics of the People’s Republic of China (NBS), since January 2016, a new Circulation and Consumer Price Statistical Form System has been implemented by the circulation and consumer price statistics in Beijing, of which the survey item directories for consumer price and retail price were revised. According to the requirements of national statistical system, the statistical year of 2015 began to be used as a new round of base period for comparison in 2016.
In accordance with the deployment of the National Bureau of Statistics of the People’s Republic of China (NBS), the reform of calculation method of regional R&D expenditure has been implemented since 2016, according to which the part of R&D expenditure not included in GDP figures were calculated additionally and GDP figures of 1996-2015 were adjusted. Moreover, the proportional data of internal spending of R&D expenditure in GDP, the energy consumption per RMB 10,000 GDP and decrease rate in 2016 and the energy consumption per RMB 10,000 GDP have also been adjusted.
Continue to strengthen the text revision work to make it easier for readers to understand the data changes. 1) To revise the content of the overview part of each chapter, comprehensively reflecting the data content, data sources, statistical standards and the historical changes of data and so on; 2) To timely revise or adjust the explanation part of the major indicators attached after the body text in each chapter according to the changes of indicators and the content of indicators of that very year and so on; 3) To update the content of notes under the tables, accurately reflecting the changes and adjustments of the data approach of that very year to make readers understand the data changes and accurately use the annual statistical data in different periods and different sectors; 4) The names of certain units have been revised uniformly according to the adjustments to the administrative bodies in Beijing.